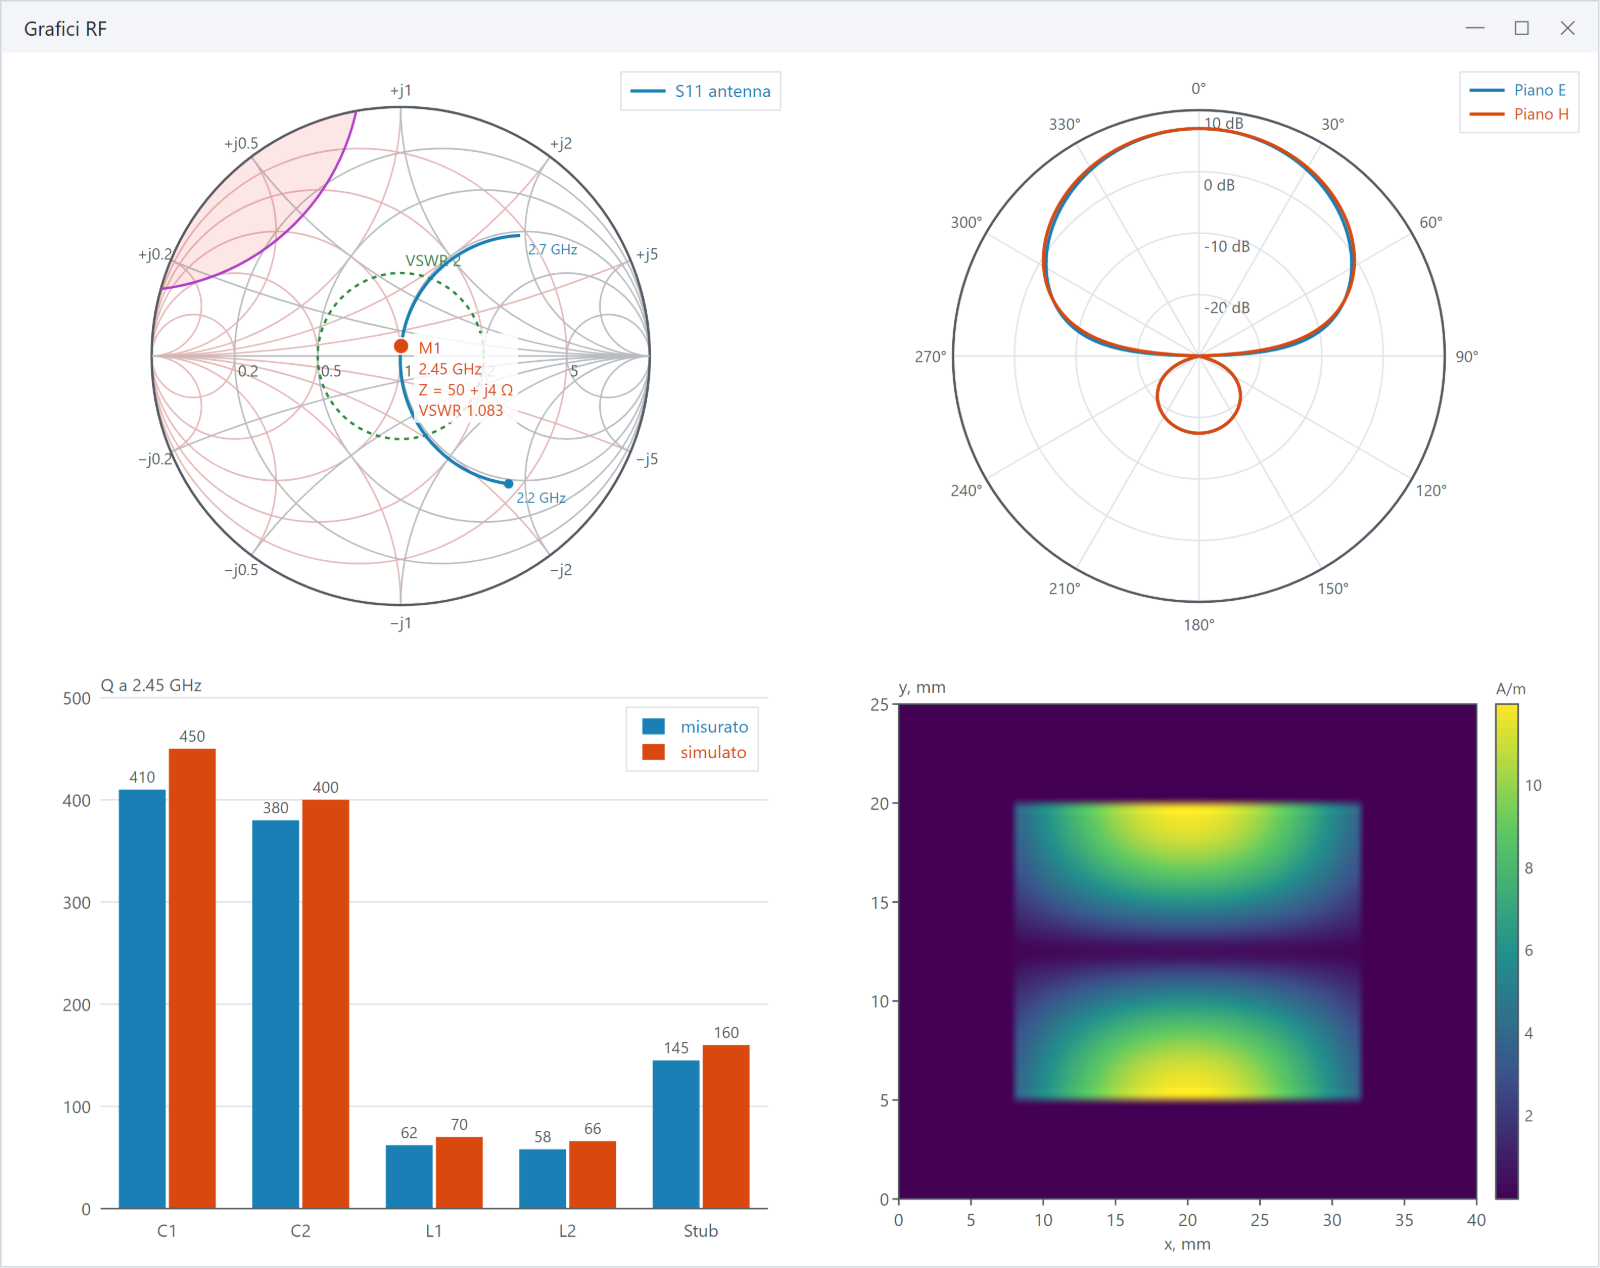
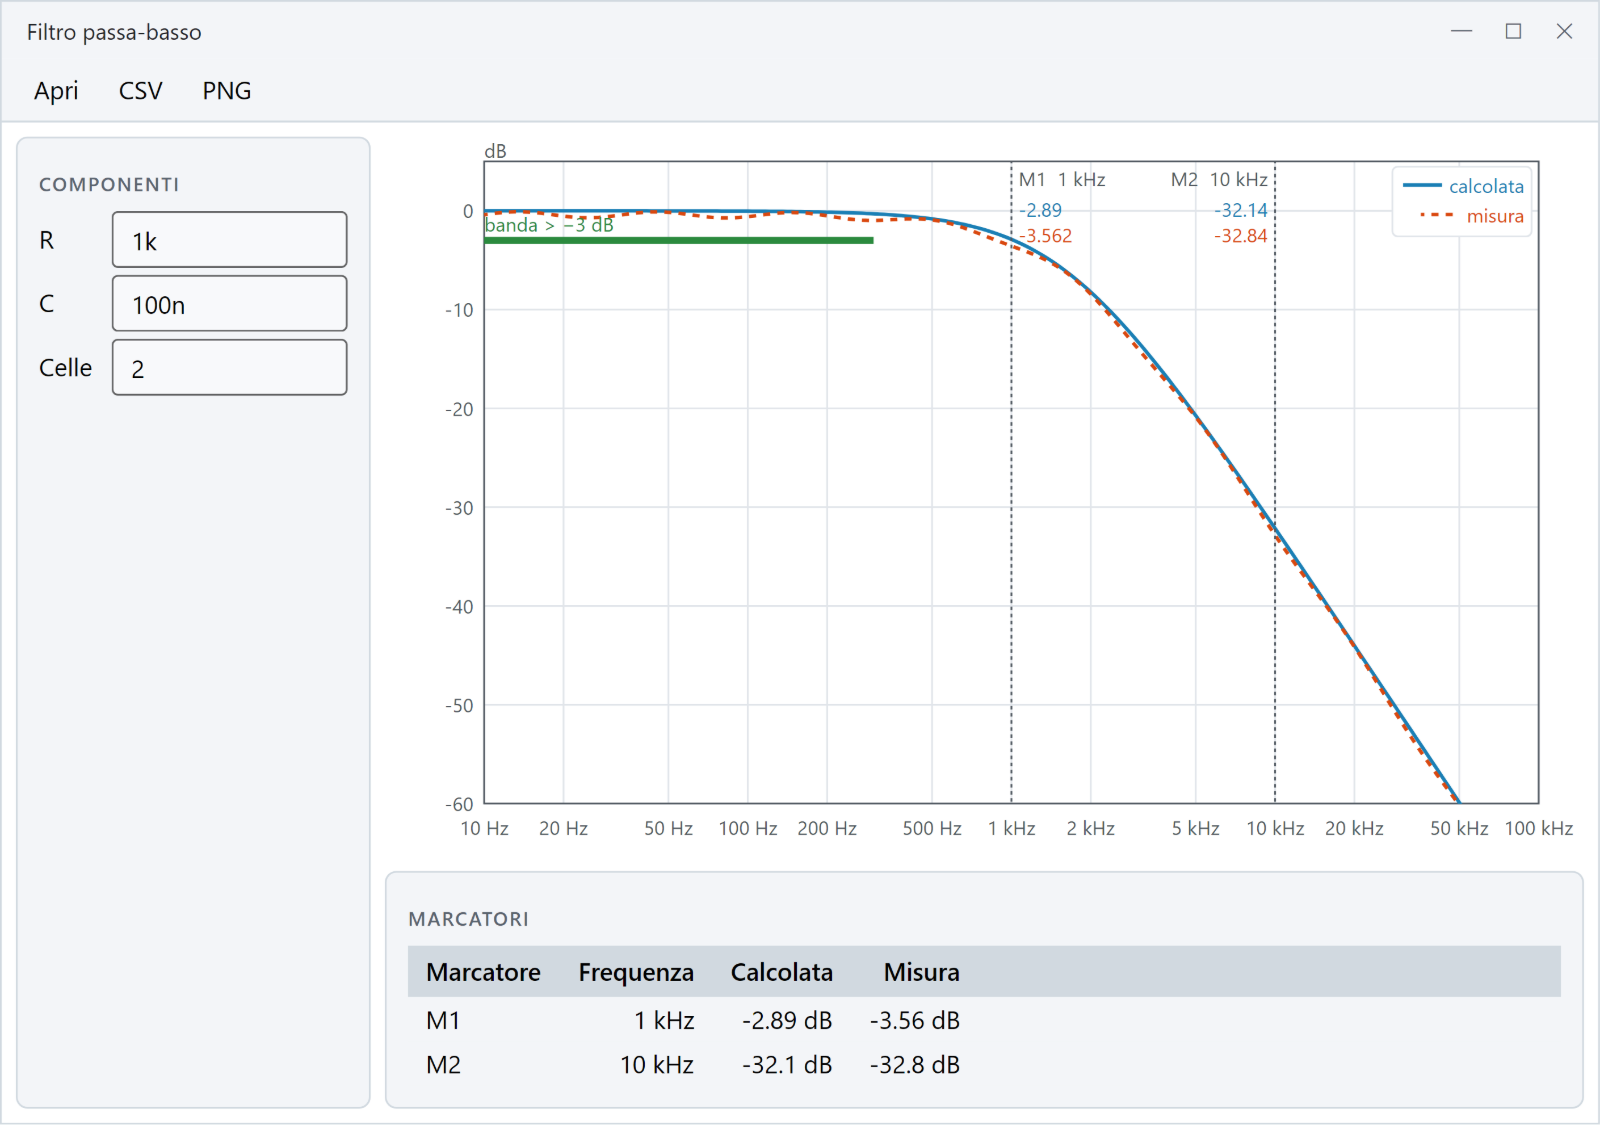
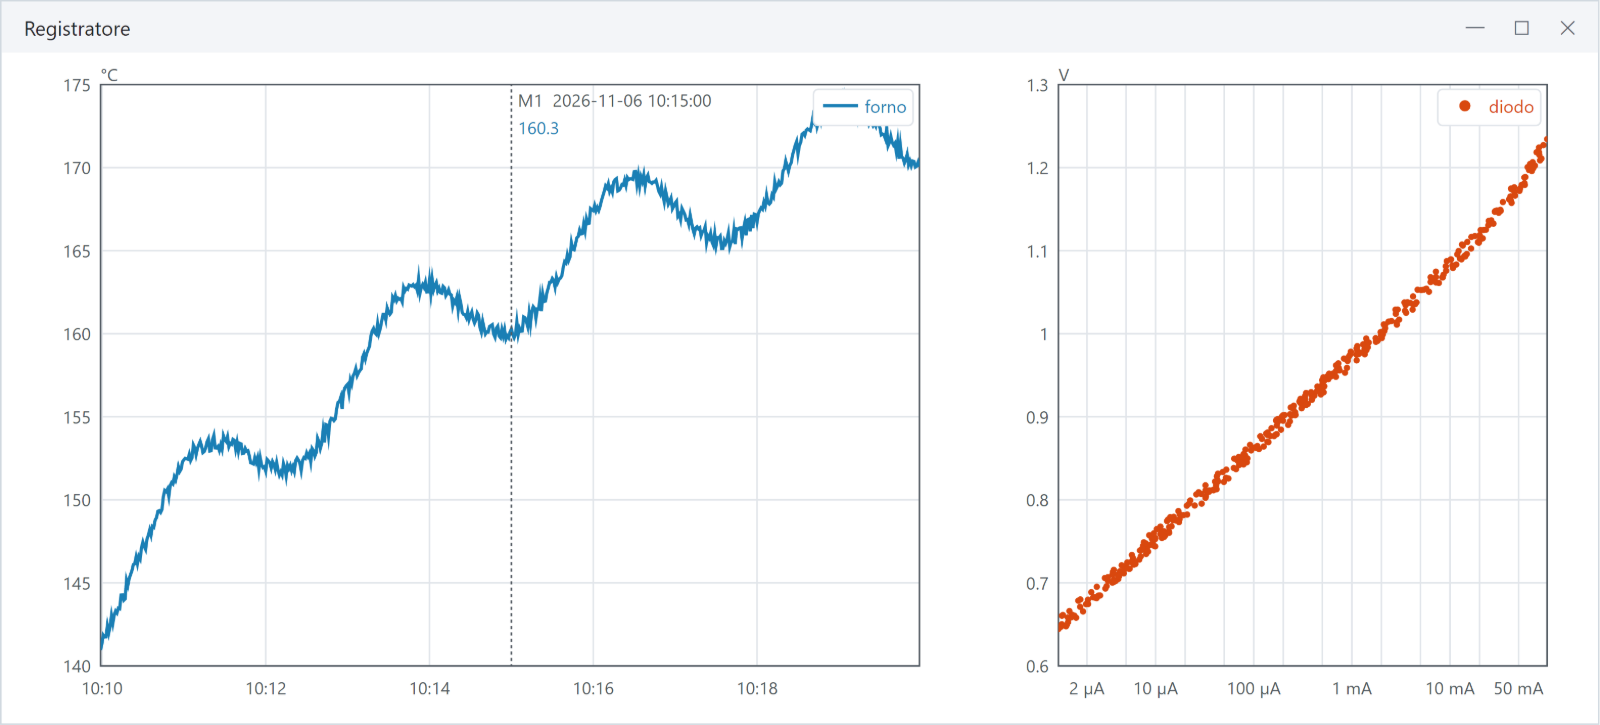
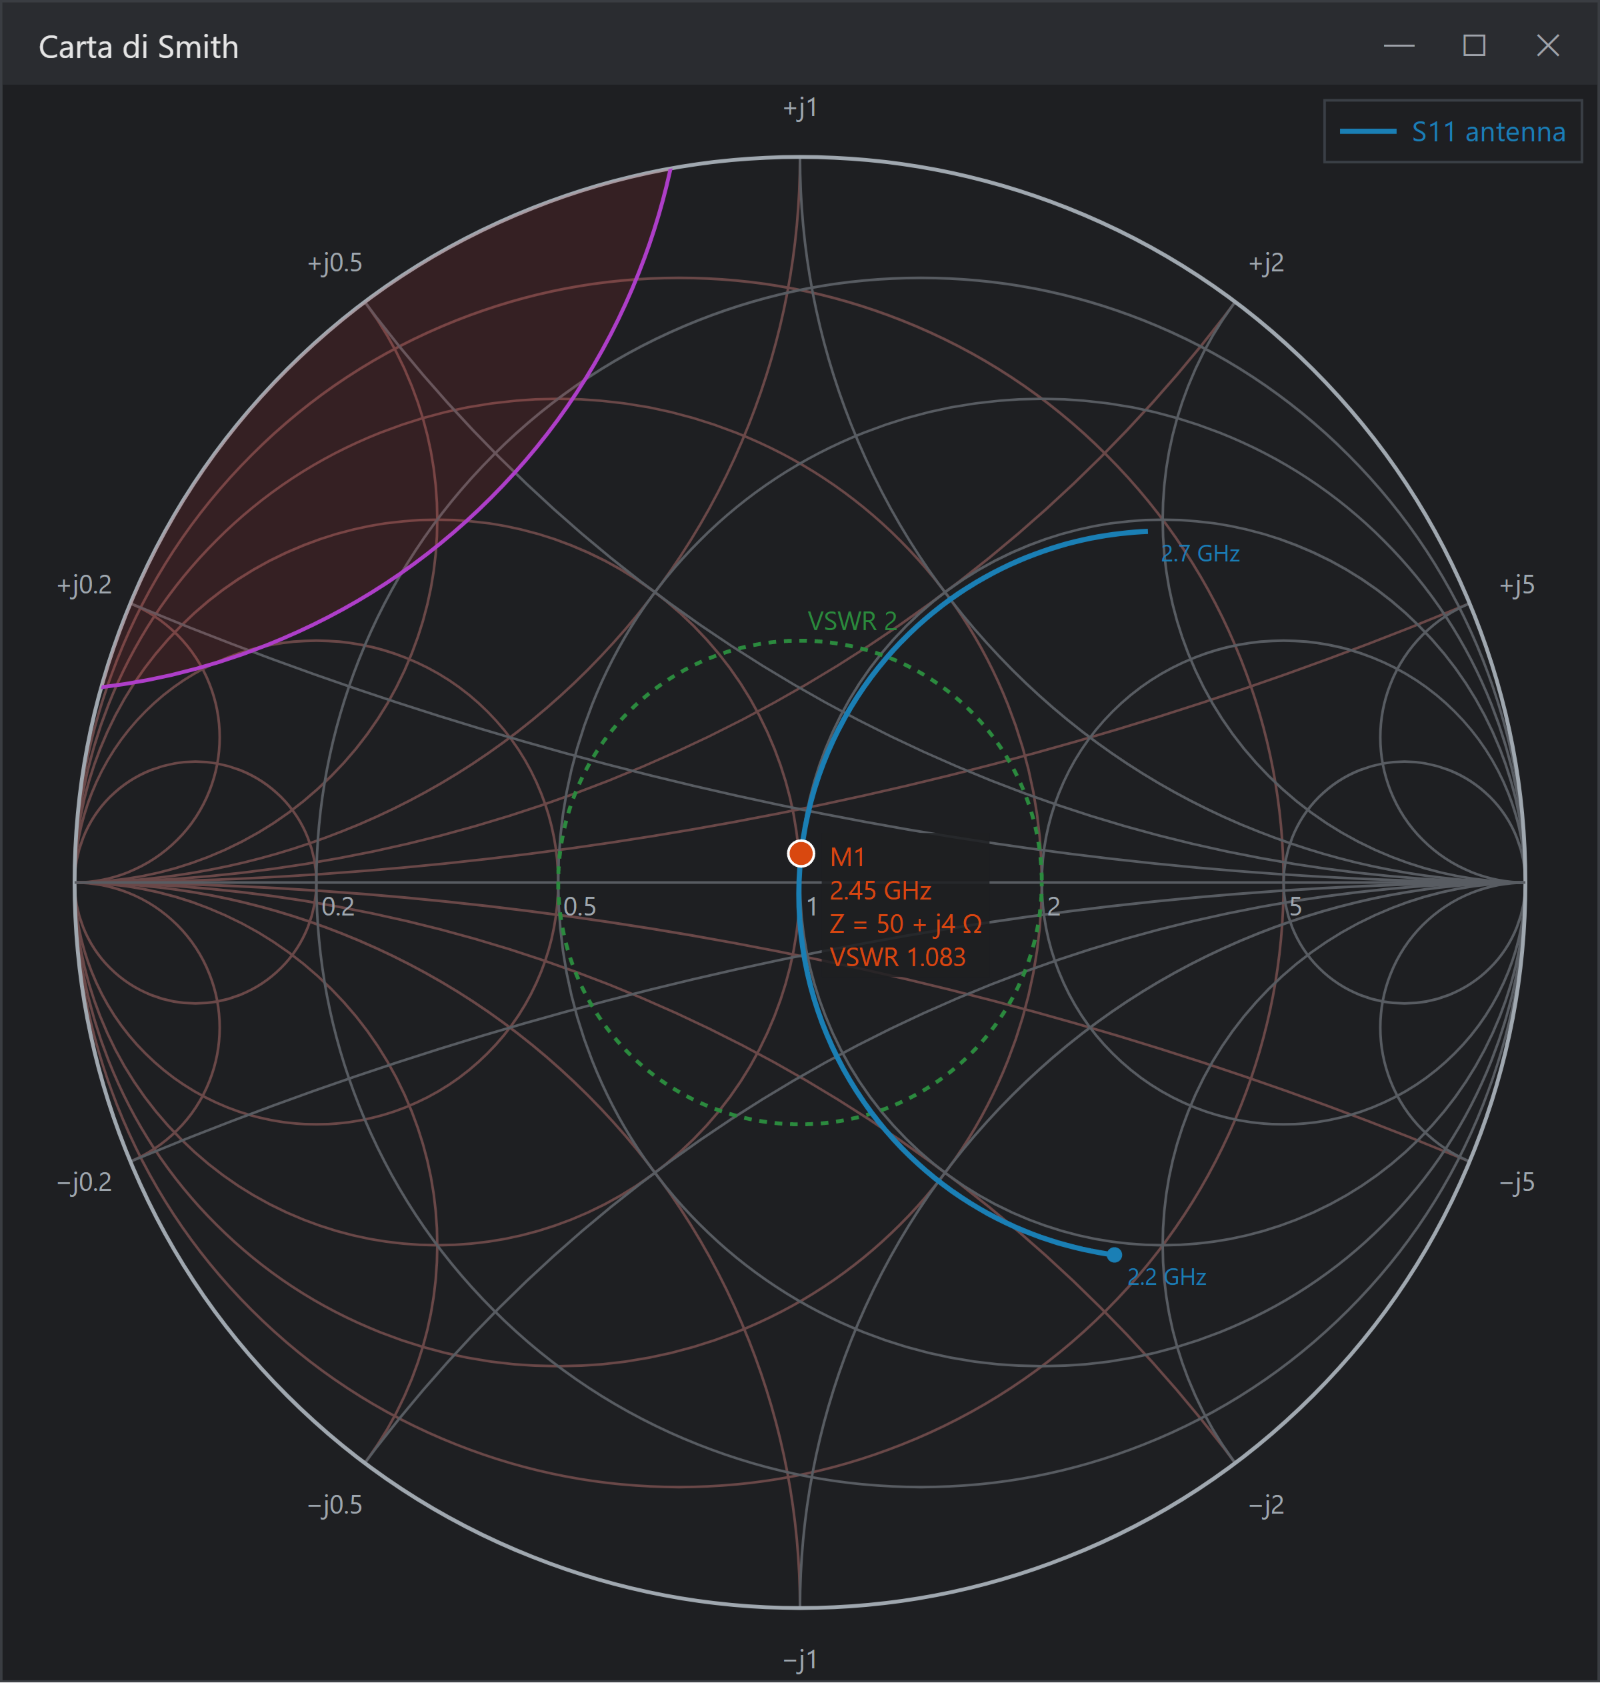
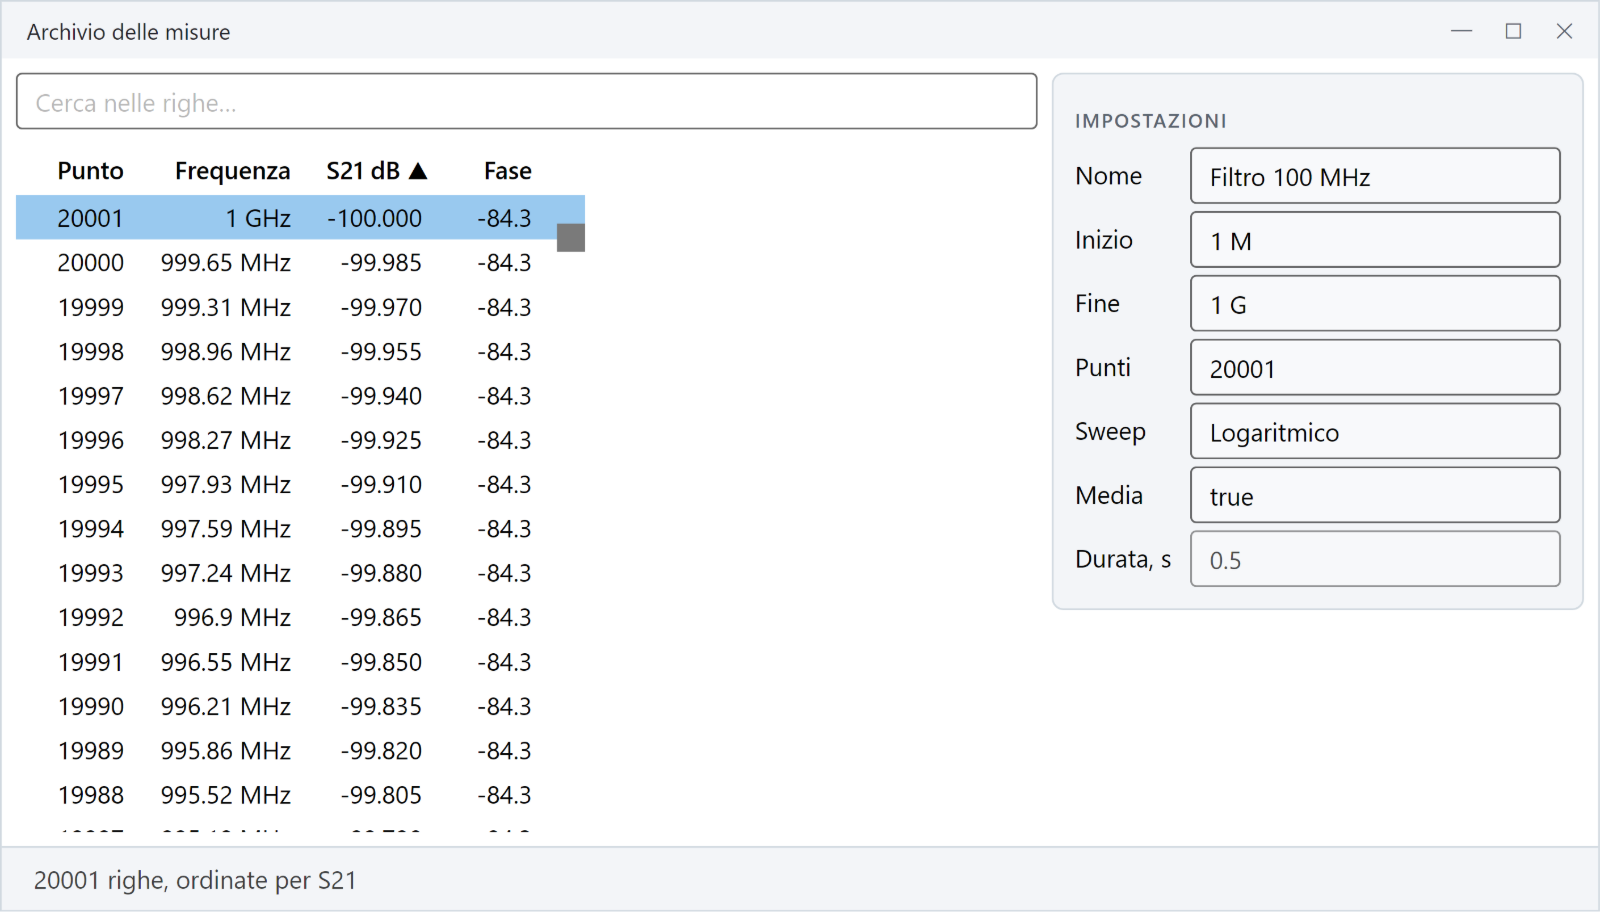
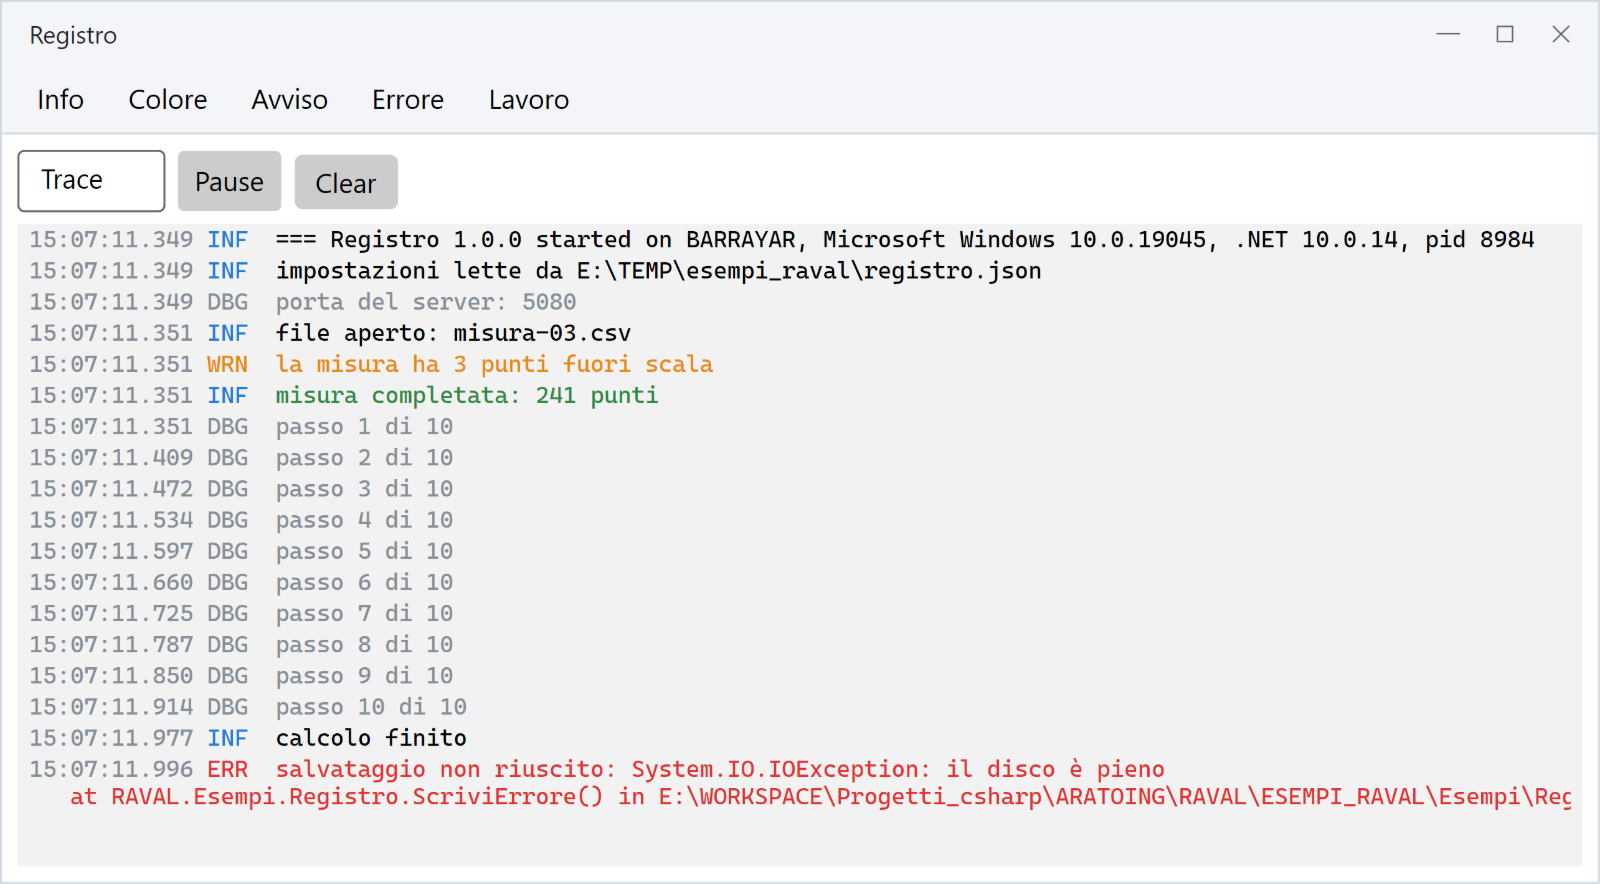
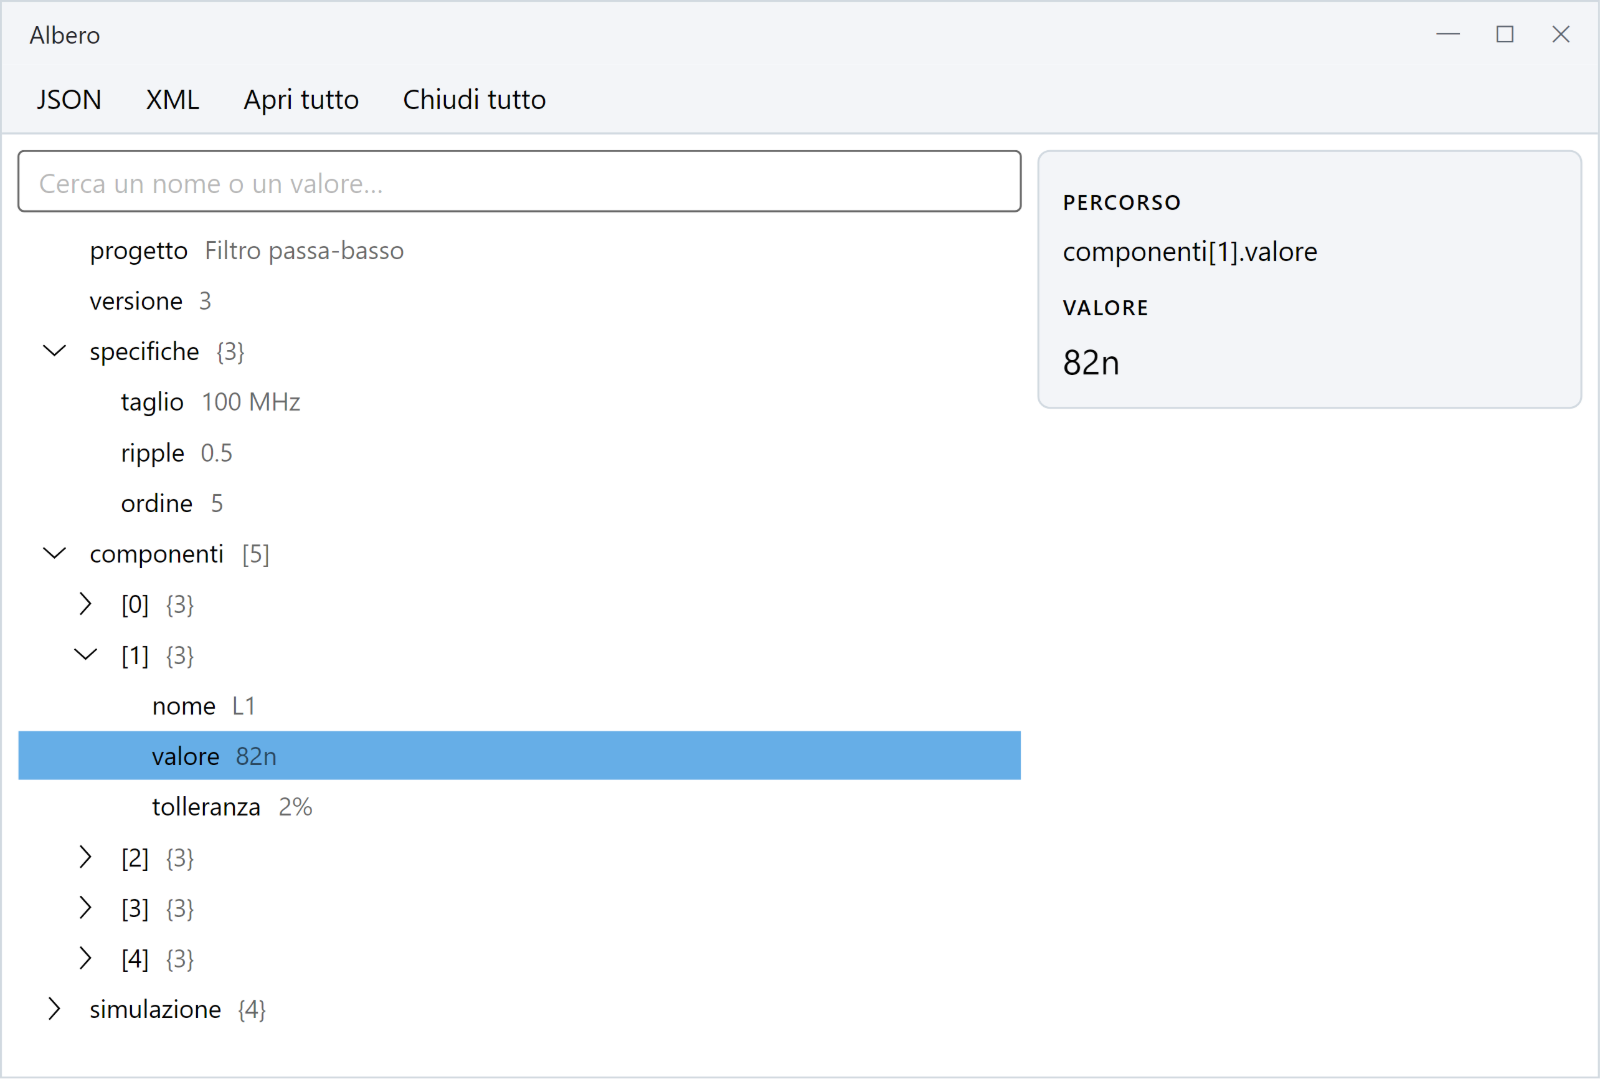
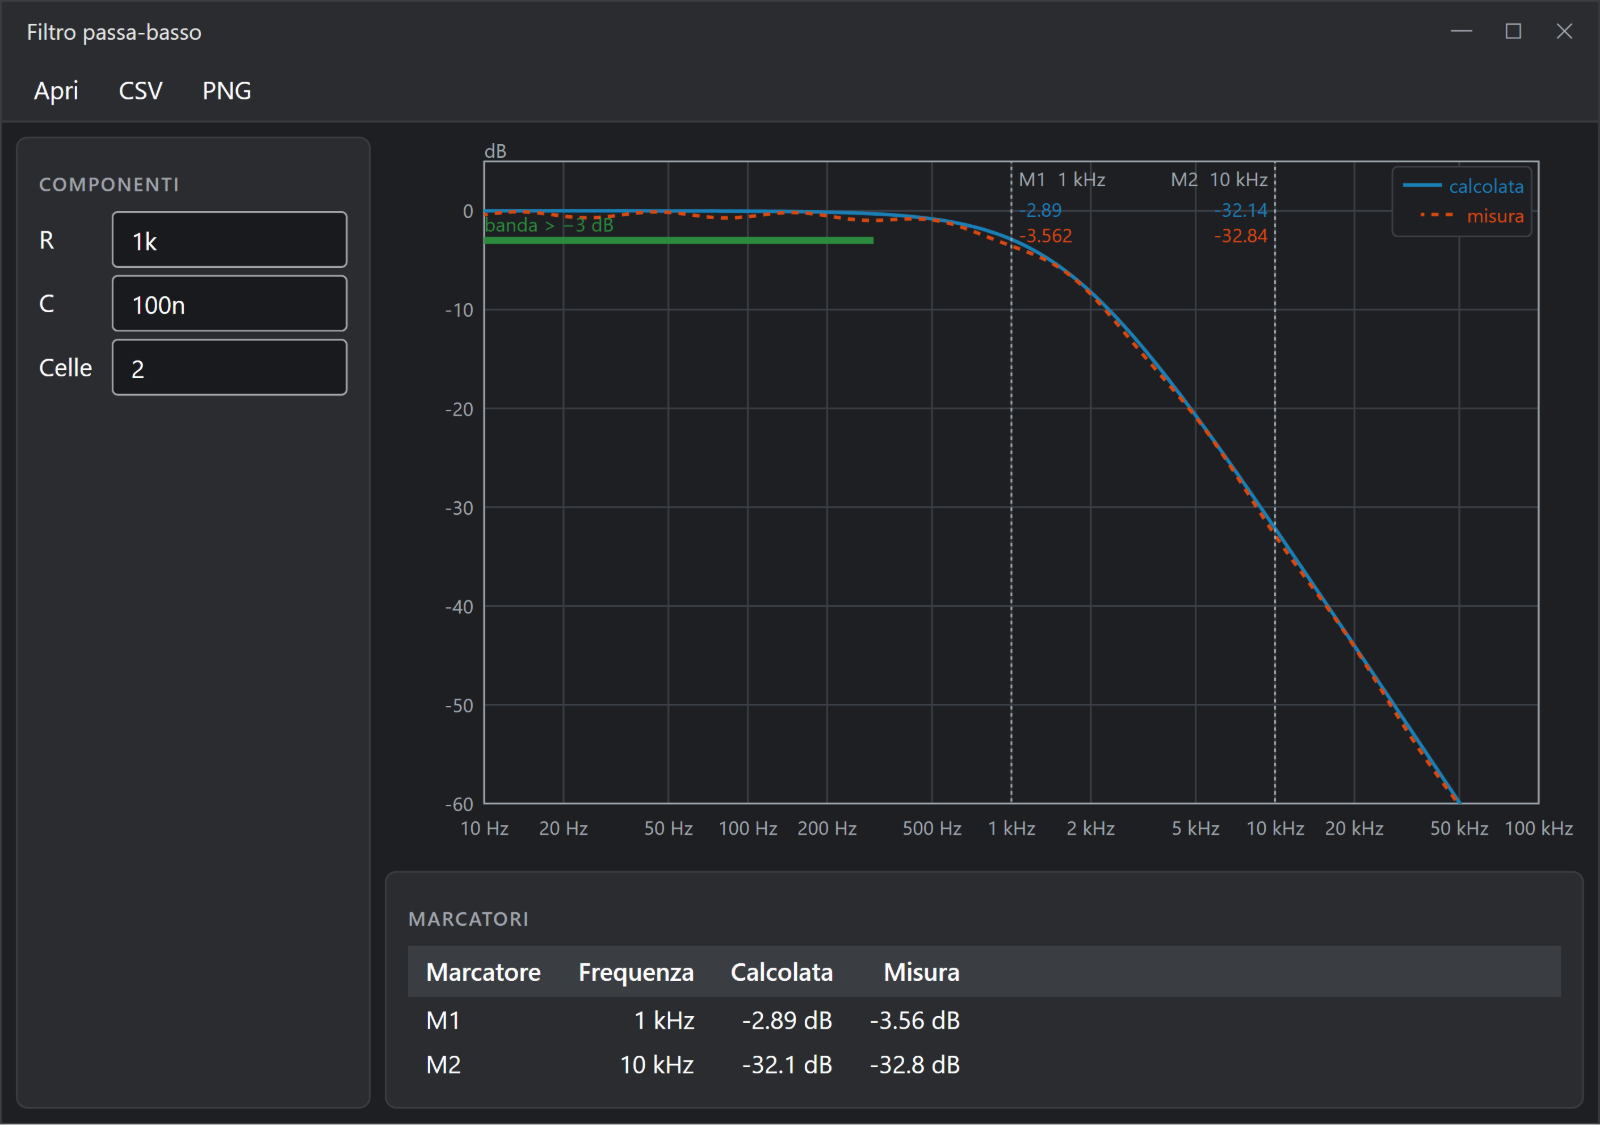
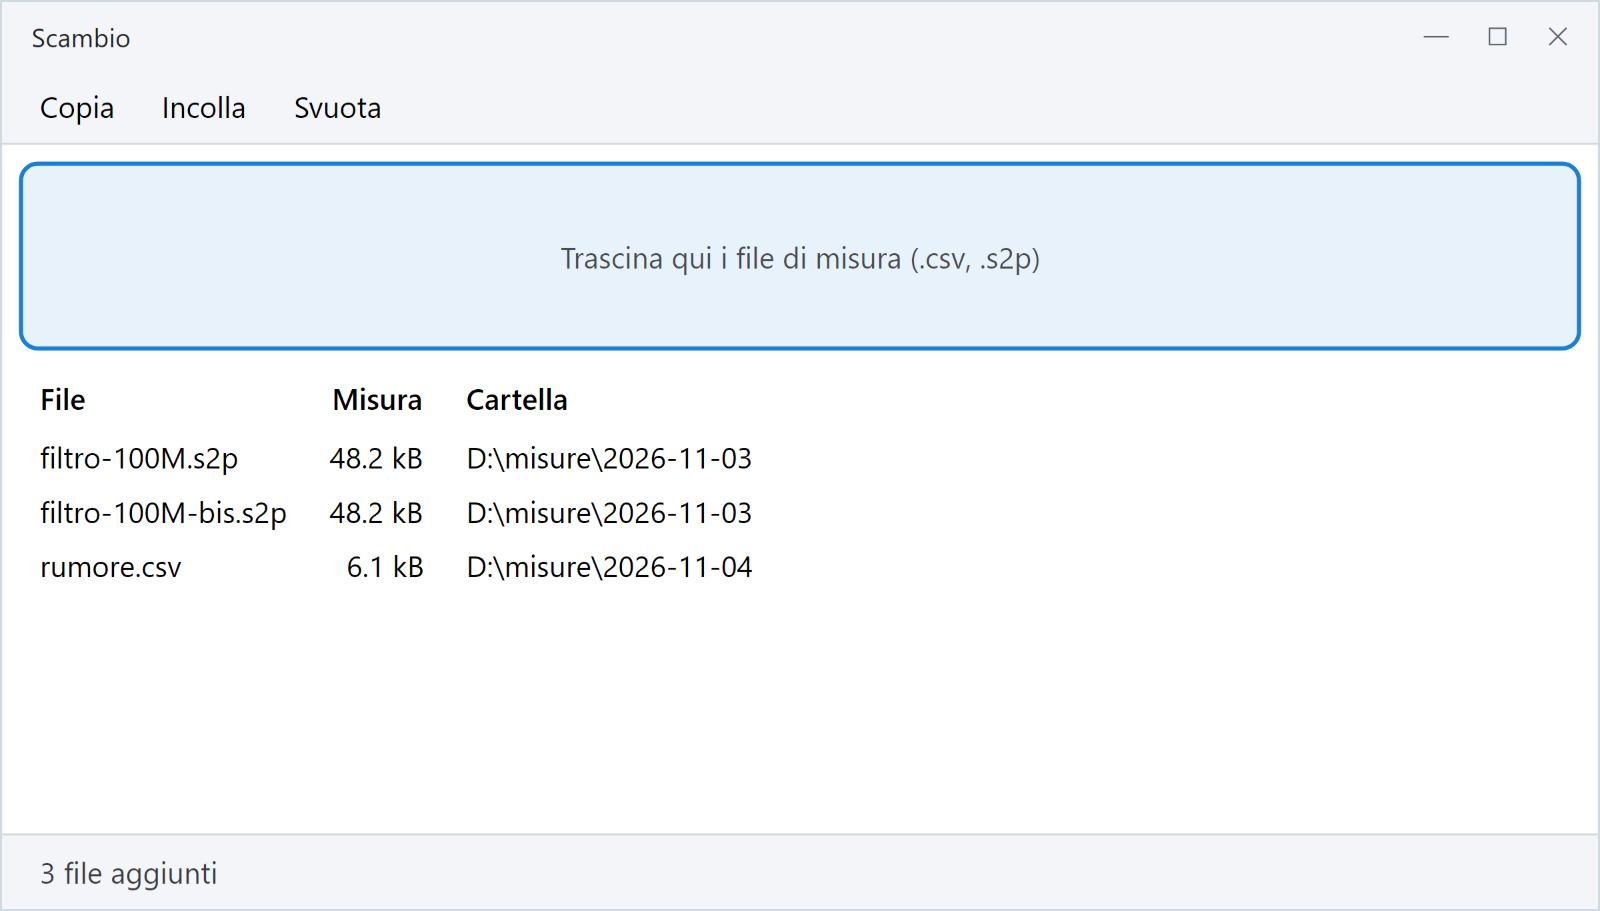
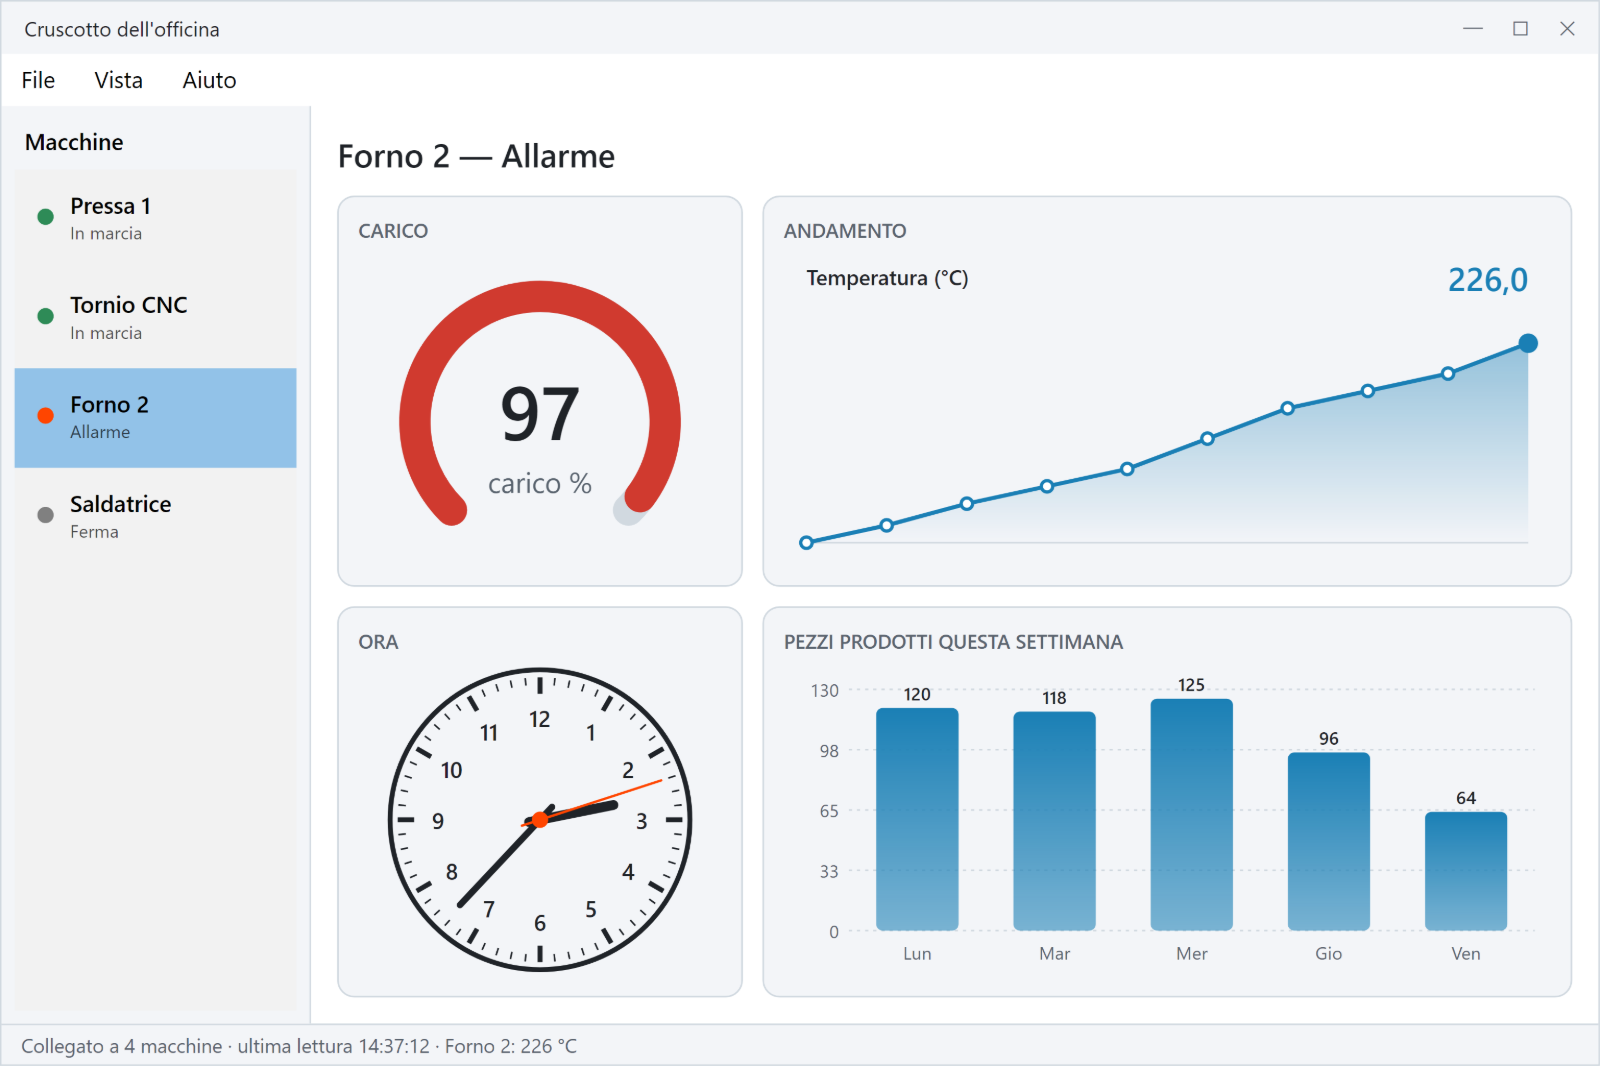
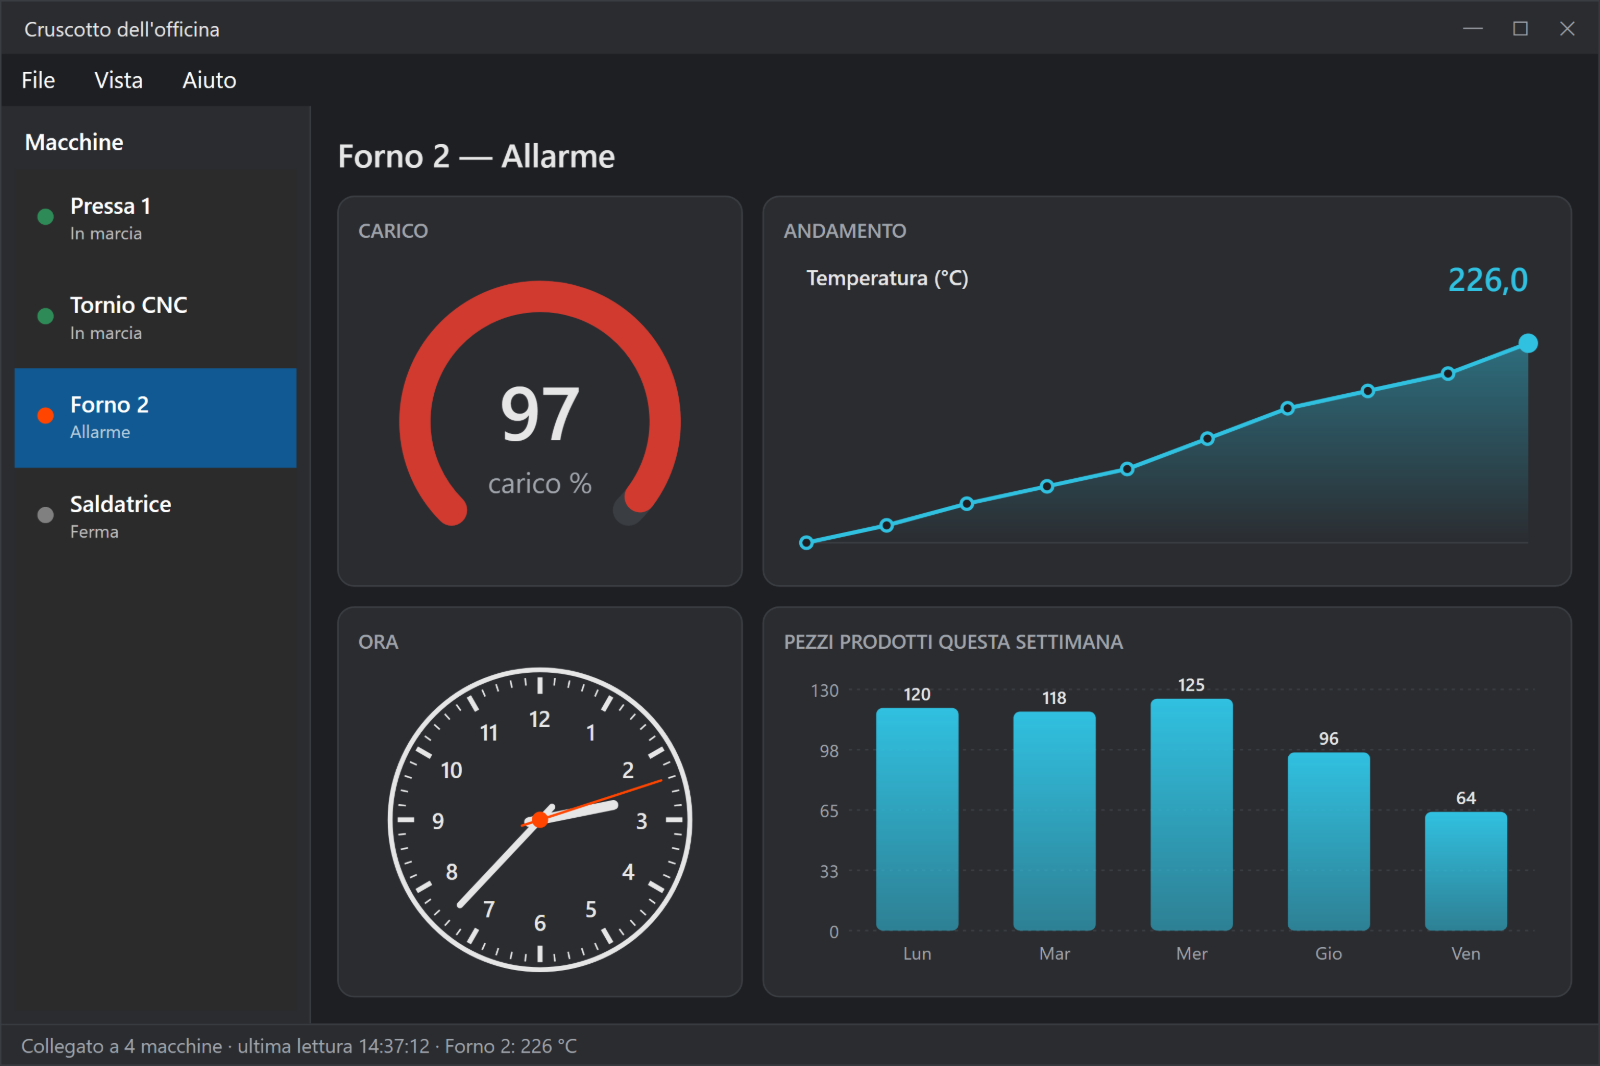
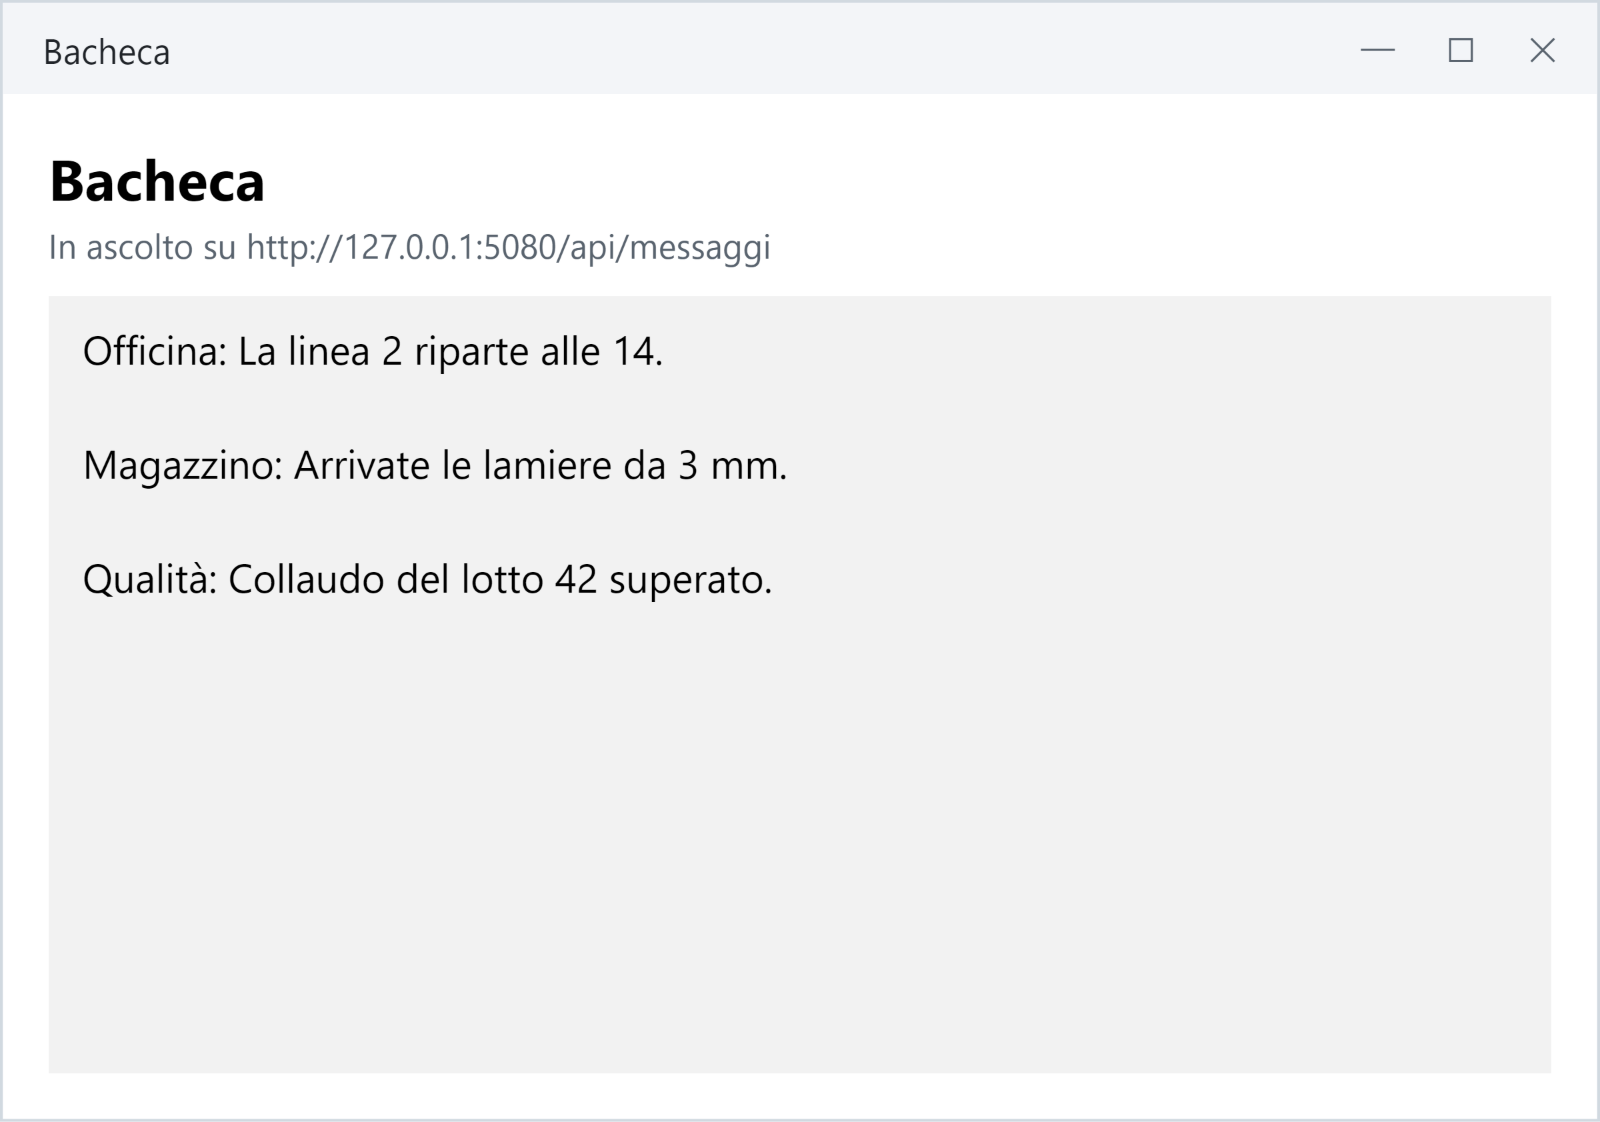
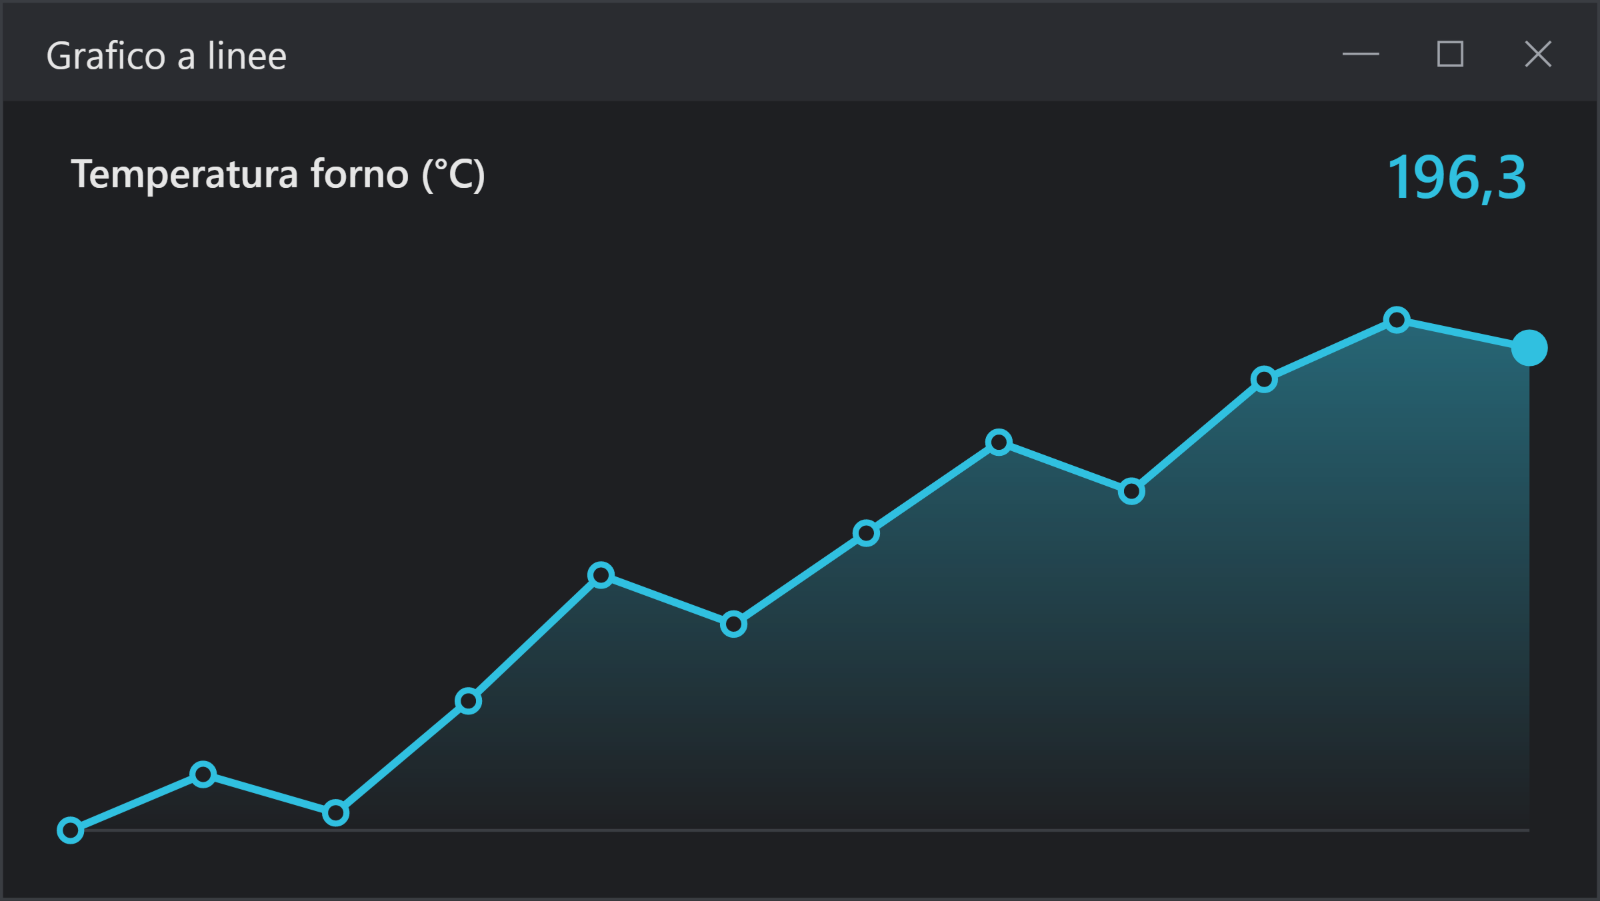
The figures of the tutorial, drawn by the example programs without a screen: they are the real windows, not mock-ups.
Smith chart, antenna pattern, bars and color mapA measuring tool: chart with markers, components, tableLive recorder with a time axis, and a scatter plotThe Smith chart in the dark themeTwenty thousand rows in a virtualized table, and an object's propertiesThe colored log, liveA JSON project in a tree, with the node pathThe tool in the dark themeFiles dropped into a tableA one-line confirmationA dashboardThe dashboard in the dark themeThe API server and its boardHand-drawn graphics