UI in code
Fluent extensions named after the properties, ready panels, events to named methods, styles in code.
MIT · .NET 10 · Avalonia 12 · v2.10.2
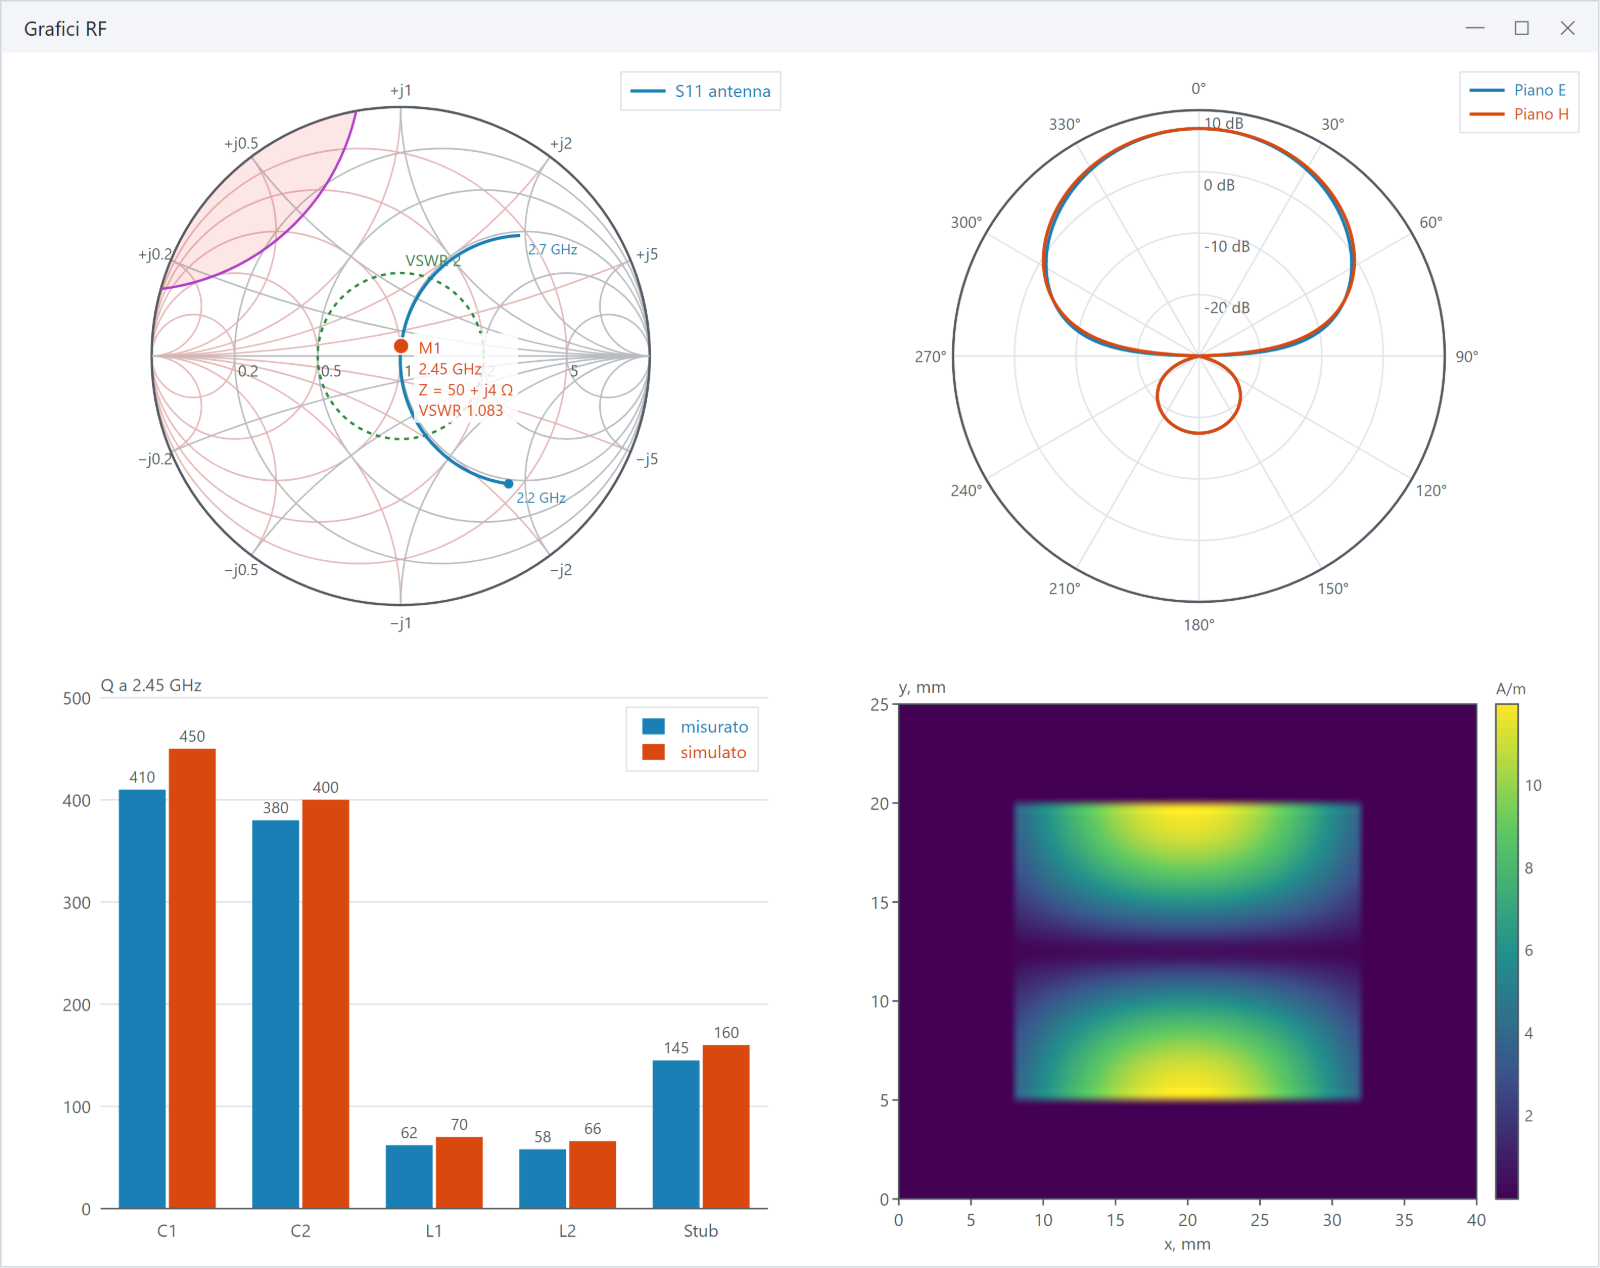
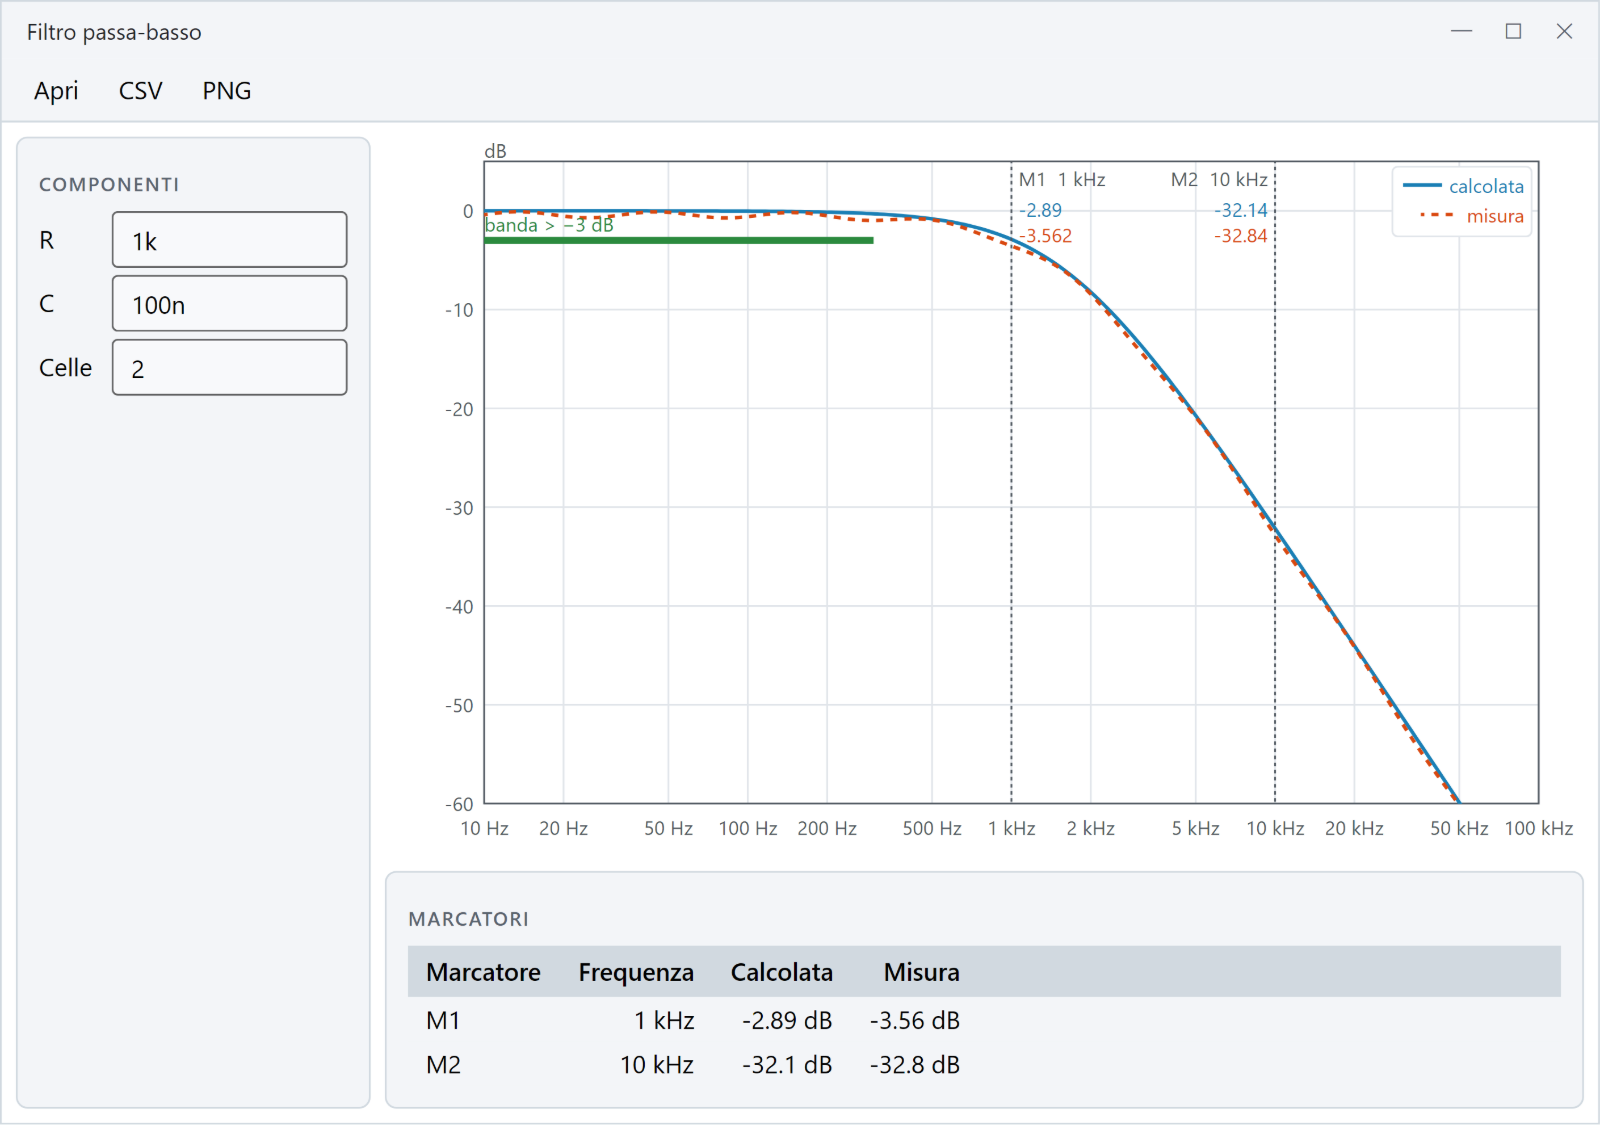
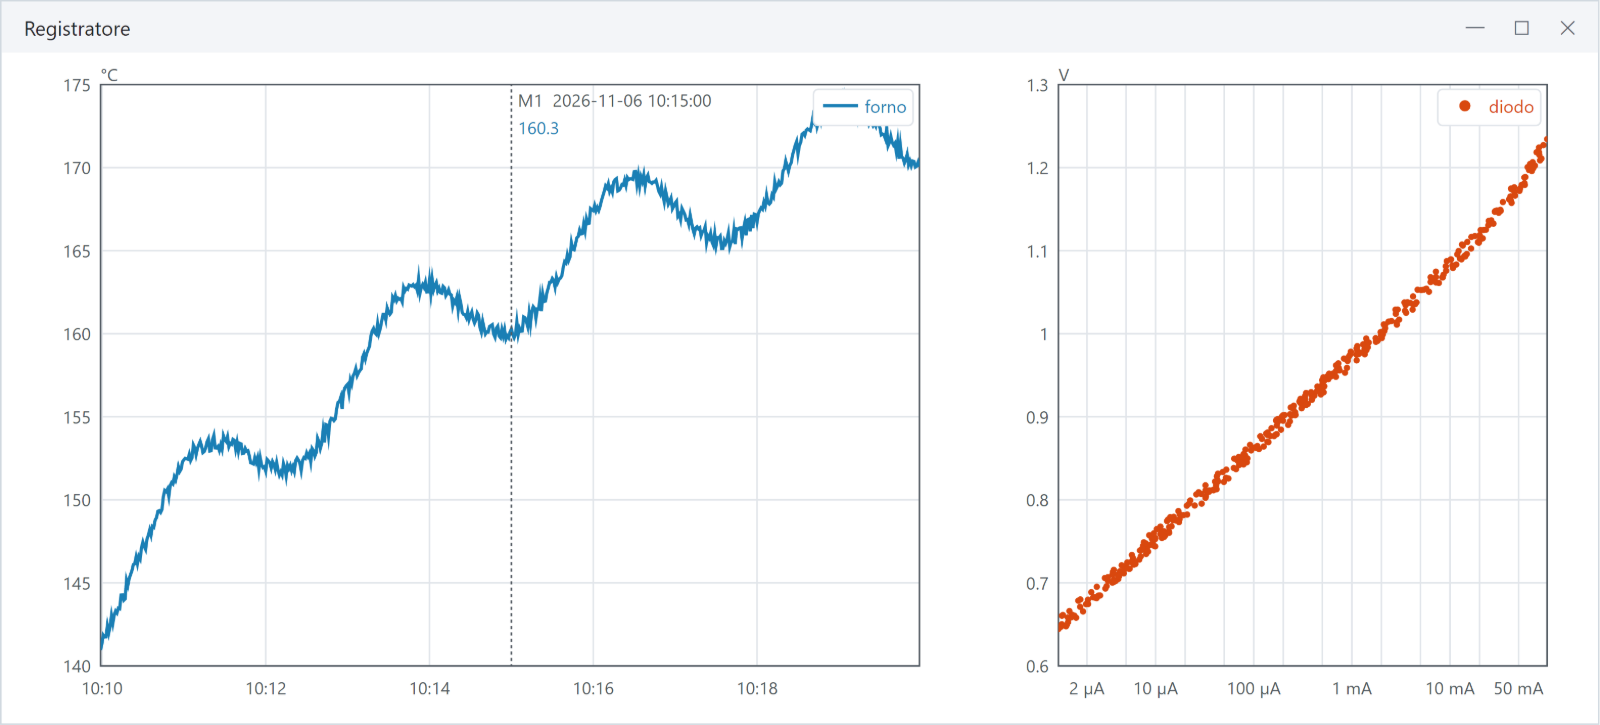
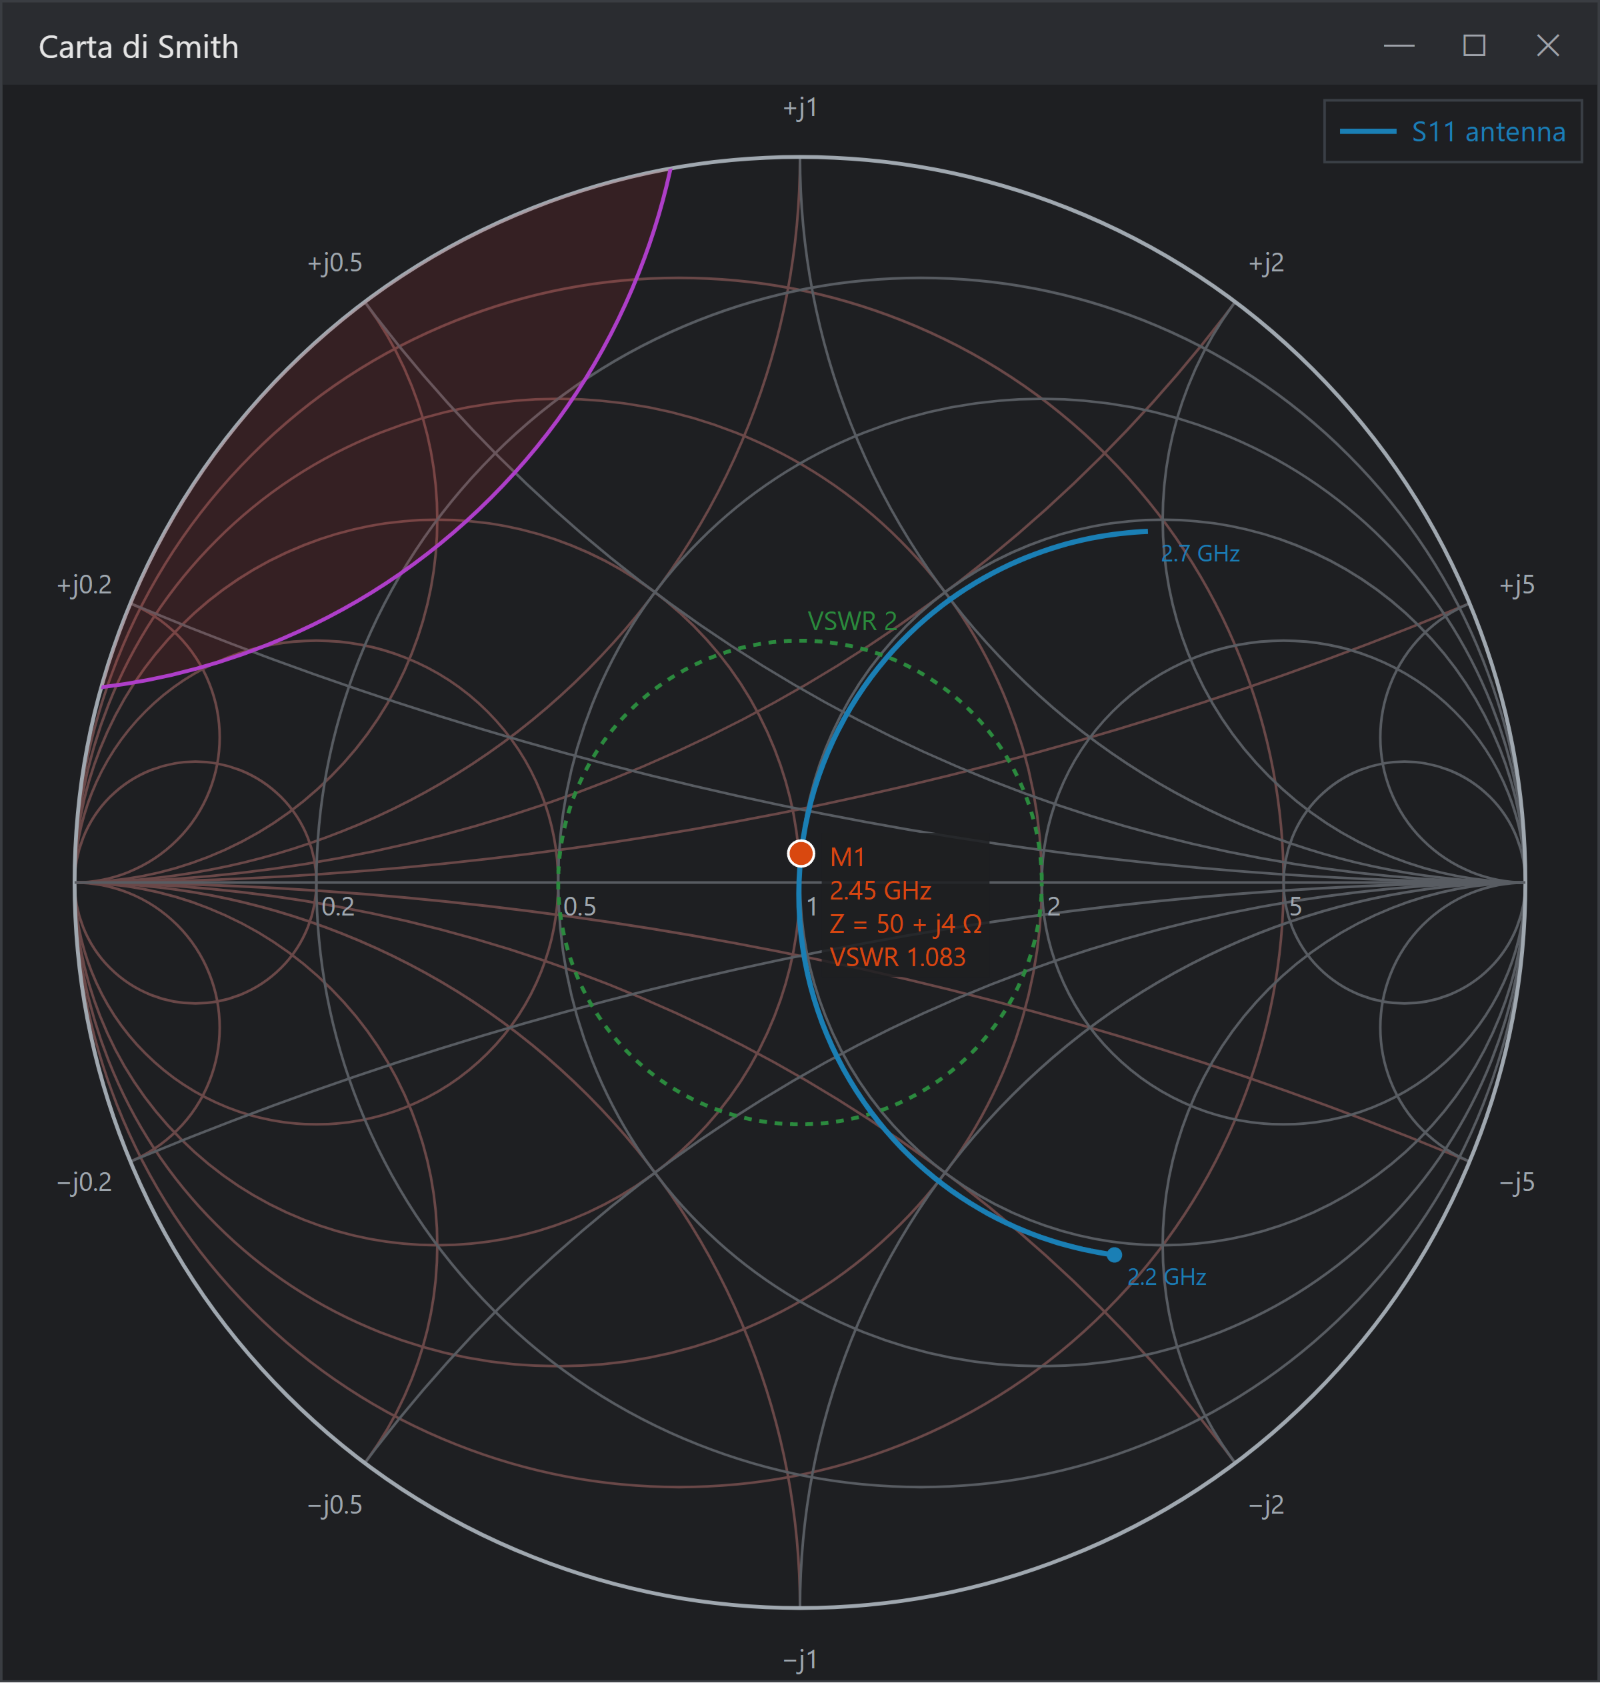
RAVAL is the in-house library of Arato Ingegneria for lab and bench software: fluent extensions to build windows in code, hand-drawn charts (curves, Smith chart, polar, bars, maps), tables of a hundred thousand rows, trees, one-line dialogs, colored log, settings, theme and languages. Free, MIT licensed.
No XAML, no bindings to guess, no lambdas: controls are built with extensions named after their properties, events go to named methods, and what you read is what happens.
55 classes657 documented signatures0 lambdas
public sealed class Contatore : Window {
  private readonly TextBlock _n = new() { FontSize = 40 };
  private int _clic;

  public Contatore() {
    Title = "Contatore";
    Content = RAva.VStack(12,
      _n.Text("0").HAlign(HorizontalAlignment.Center),
      new Button().Content("+1").OnClick(Aggiungi))
      .Margin(24);
  }

  private void Aggiungi() => _n.Text = (++_clic).ToString();
}Fluent extensions named after the properties, ready panels, events to named methods, styles in code.
Curves with markers, time axes and live data; Smith chart, polar, bars, color maps; figures at 300 dpi.
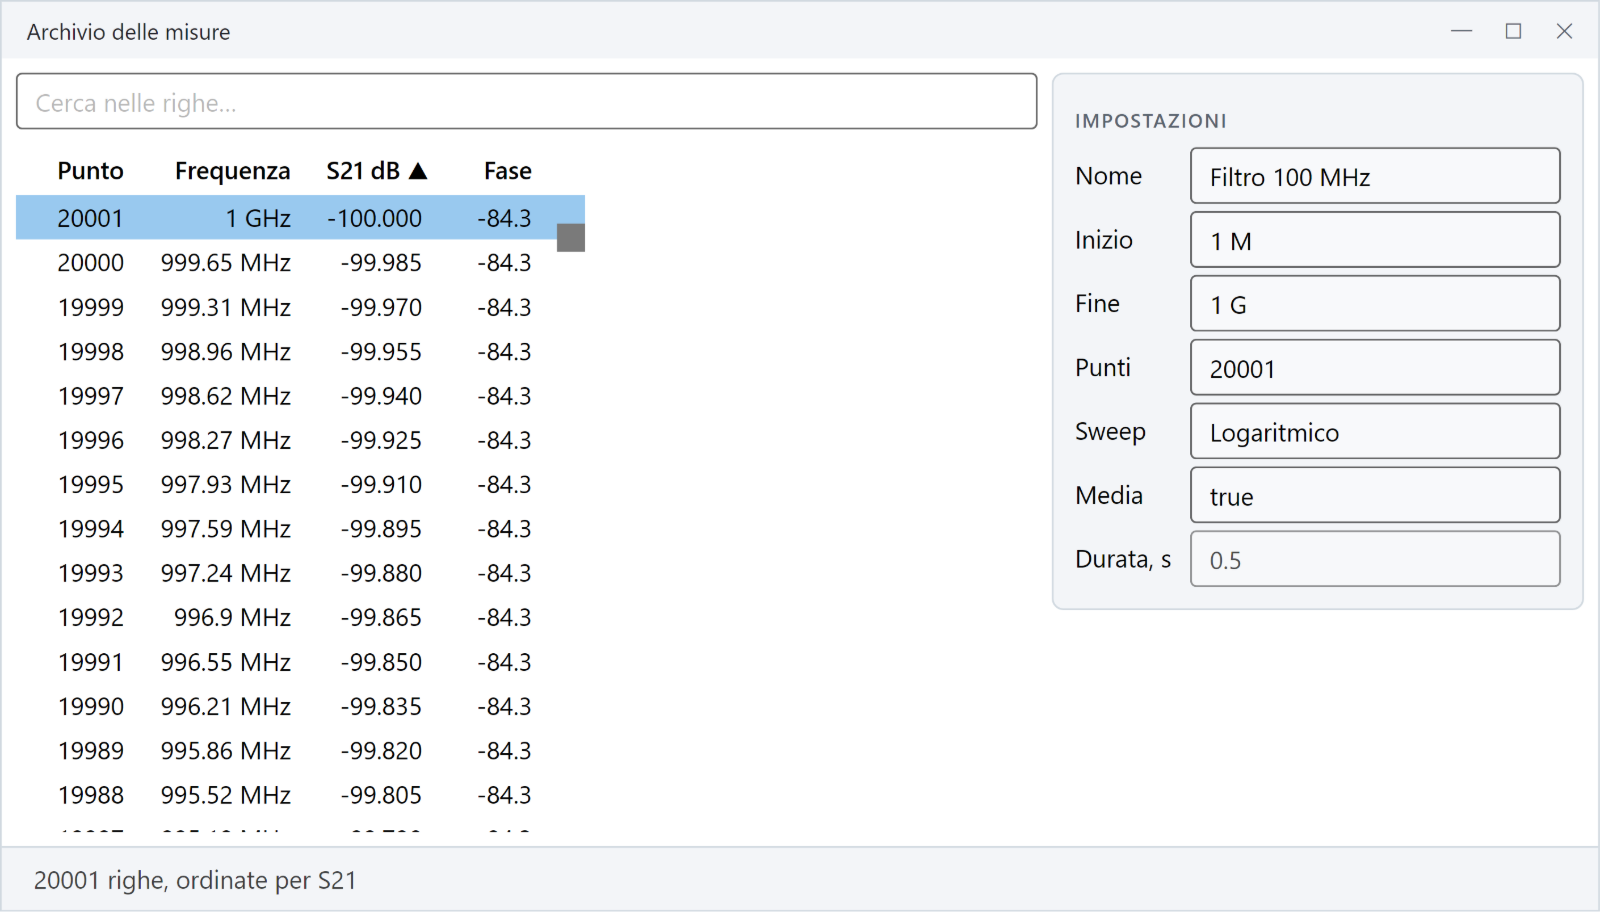
Tables of a hundred thousand rows, object properties, trees of JSON and XML, numbers with SI prefixes.
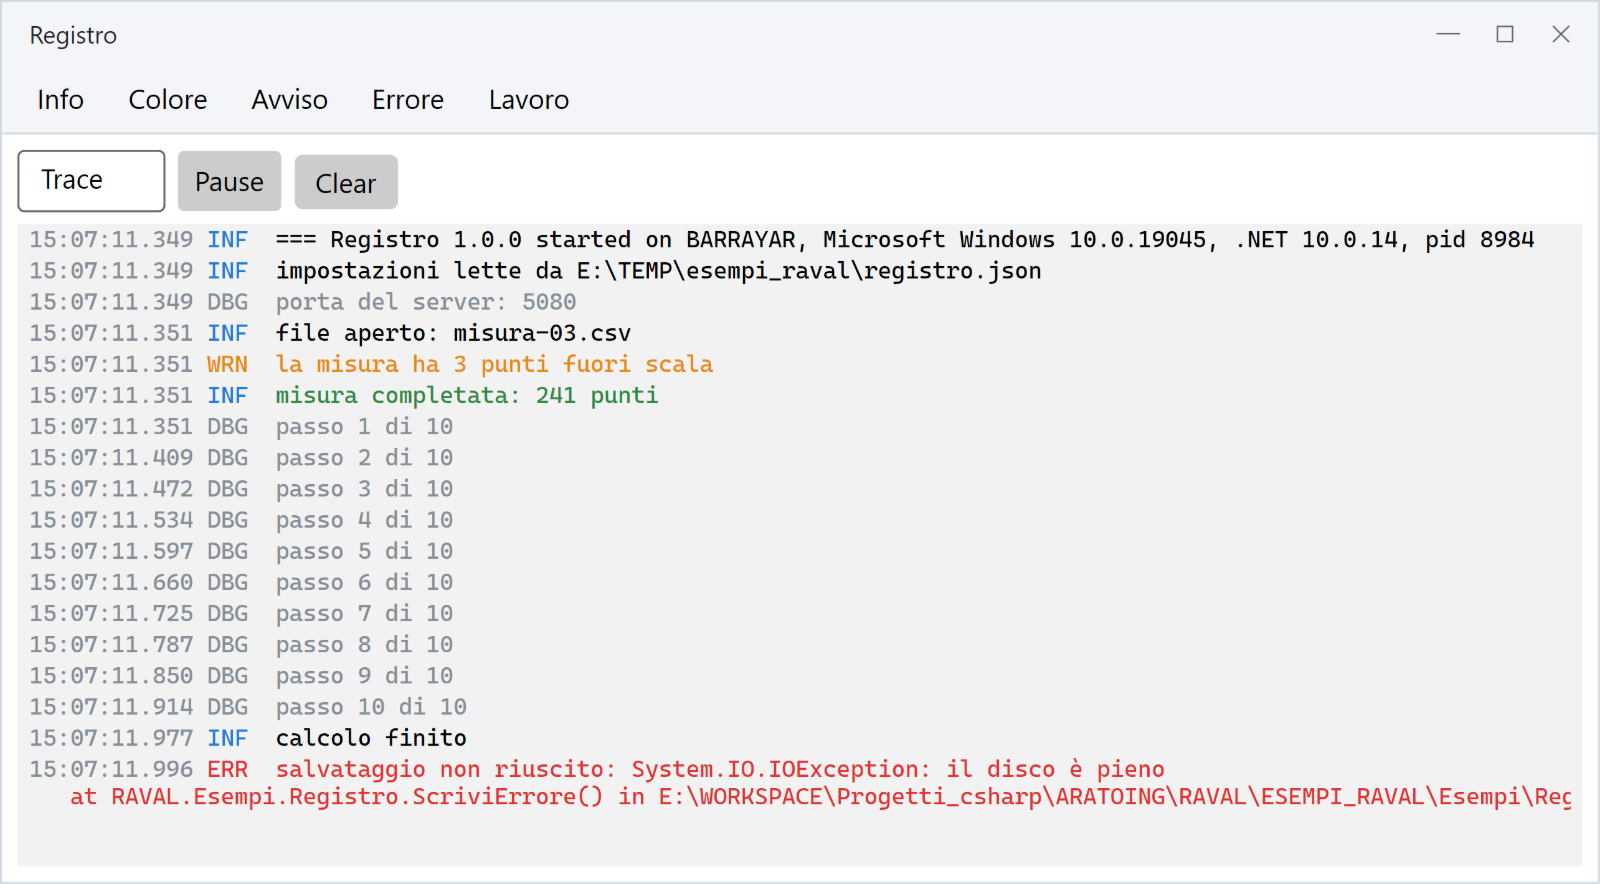
Colored log with its window, JSON and INI settings, light/dark/system theme, languages.
One-line awaited questions, files as paths, clipboard with tables, file drag and drop.
A JSON server on Kestrel in a few lines, with calls on the UI thread when needed.